Exploratory Data Analysis
Data Overview
This report provides a detailed summary of the dataset, which contains information on health indicators and the condition of diabetes in a population. This initial analysis offers an overview of the data structure, volume, and the nature of the variables.
Number of Observations and Variables
The dataset contains a total of 253,680 observations and includes 22 variables that represent different health indicators or demographic characteristics relevant to diabetes analysis.
Present Variables and data type
| Variable | Type | Data Type | Description |
|---|---|---|---|
| Diabetes_binary | Target | Binary | 0 = no diabetes, 1 = prediabetes or diabetes |
| HighBP | Feature | Binary | 0 = no high BP, 1 = high BP |
| HighChol | Feature | Binary | 0 = no high cholesterol, 1 = high cholesterol |
| CholCheck | Feature | Binary | 0 = no cholesterol check in 5 years, 1 = yes cholesterol check in 5 years |
| BMI | Feature | Integer | Body Mass Index |
| Smoker | Feature | Binary | Have you smoked at least 100 cigarettes in your life? 0 = no, 1 = yes |
| Stroke | Feature | Binary | Ever told you had a stroke. 0 = no, 1 = yes |
| HeartDiseaseorAttack | Feature | Binary | Coronary heart disease (CHD) or myocardial infarction (MI) 0 = no, 1 = yes |
| PhysActivity | Feature | Binary | Physical activity in the past 30 days (excluding job) 0 = no, 1 = yes |
| Fruits | Feature | Binary | Consume fruit 1 or more times per day. 0 = no, 1 = yes |
| Veggies | Feature | Binary | Consume vegetables 1 or more times per day. 0 = no, 1 = yes |
| HvyAlcoholConsump | Feature | Binary | Heavy drinkers (men > 14 drinks/week, women > 7 drinks/week). 0 = no, 1 = yes |
| AnyHealthcare | Feature | Binary | Have any healthcare coverage. 0 = no, 1 = yes |
| NoDocbcCost | Feature | Binary | Did not see a doctor due to cost in the past 12 months. 0 = no, 1 = yes |
| GenHlth | Feature | Integer | General health self-assessment scale 1-5 (1 = excellent, 5 = poor) |
| MentHlth | Feature | Integer | Days of poor mental health in the last 30 days (scale 1-30) |
| PhysHlth | Feature | Integer | Days of poor physical health in the last 30 days (scale 1-30) |
| DiffWalk | Feature | Binary | Serious difficulty walking or climbing stairs. 0 = no, 1 = yes |
| Sex | Feature | Binary | 0 = female, 1 = male |
| Age | Feature | Integer | 13-level age category (1 = 18-24, 13 = 80 or older) |
| Education | Feature | Integer | Education level (scale 1-6, 1 = no school, 6 = college graduate) |
| Income | Feature | Integer | Income level (scale 1-8, 1 = less than 10,000, 8 = 75,000 or more) |
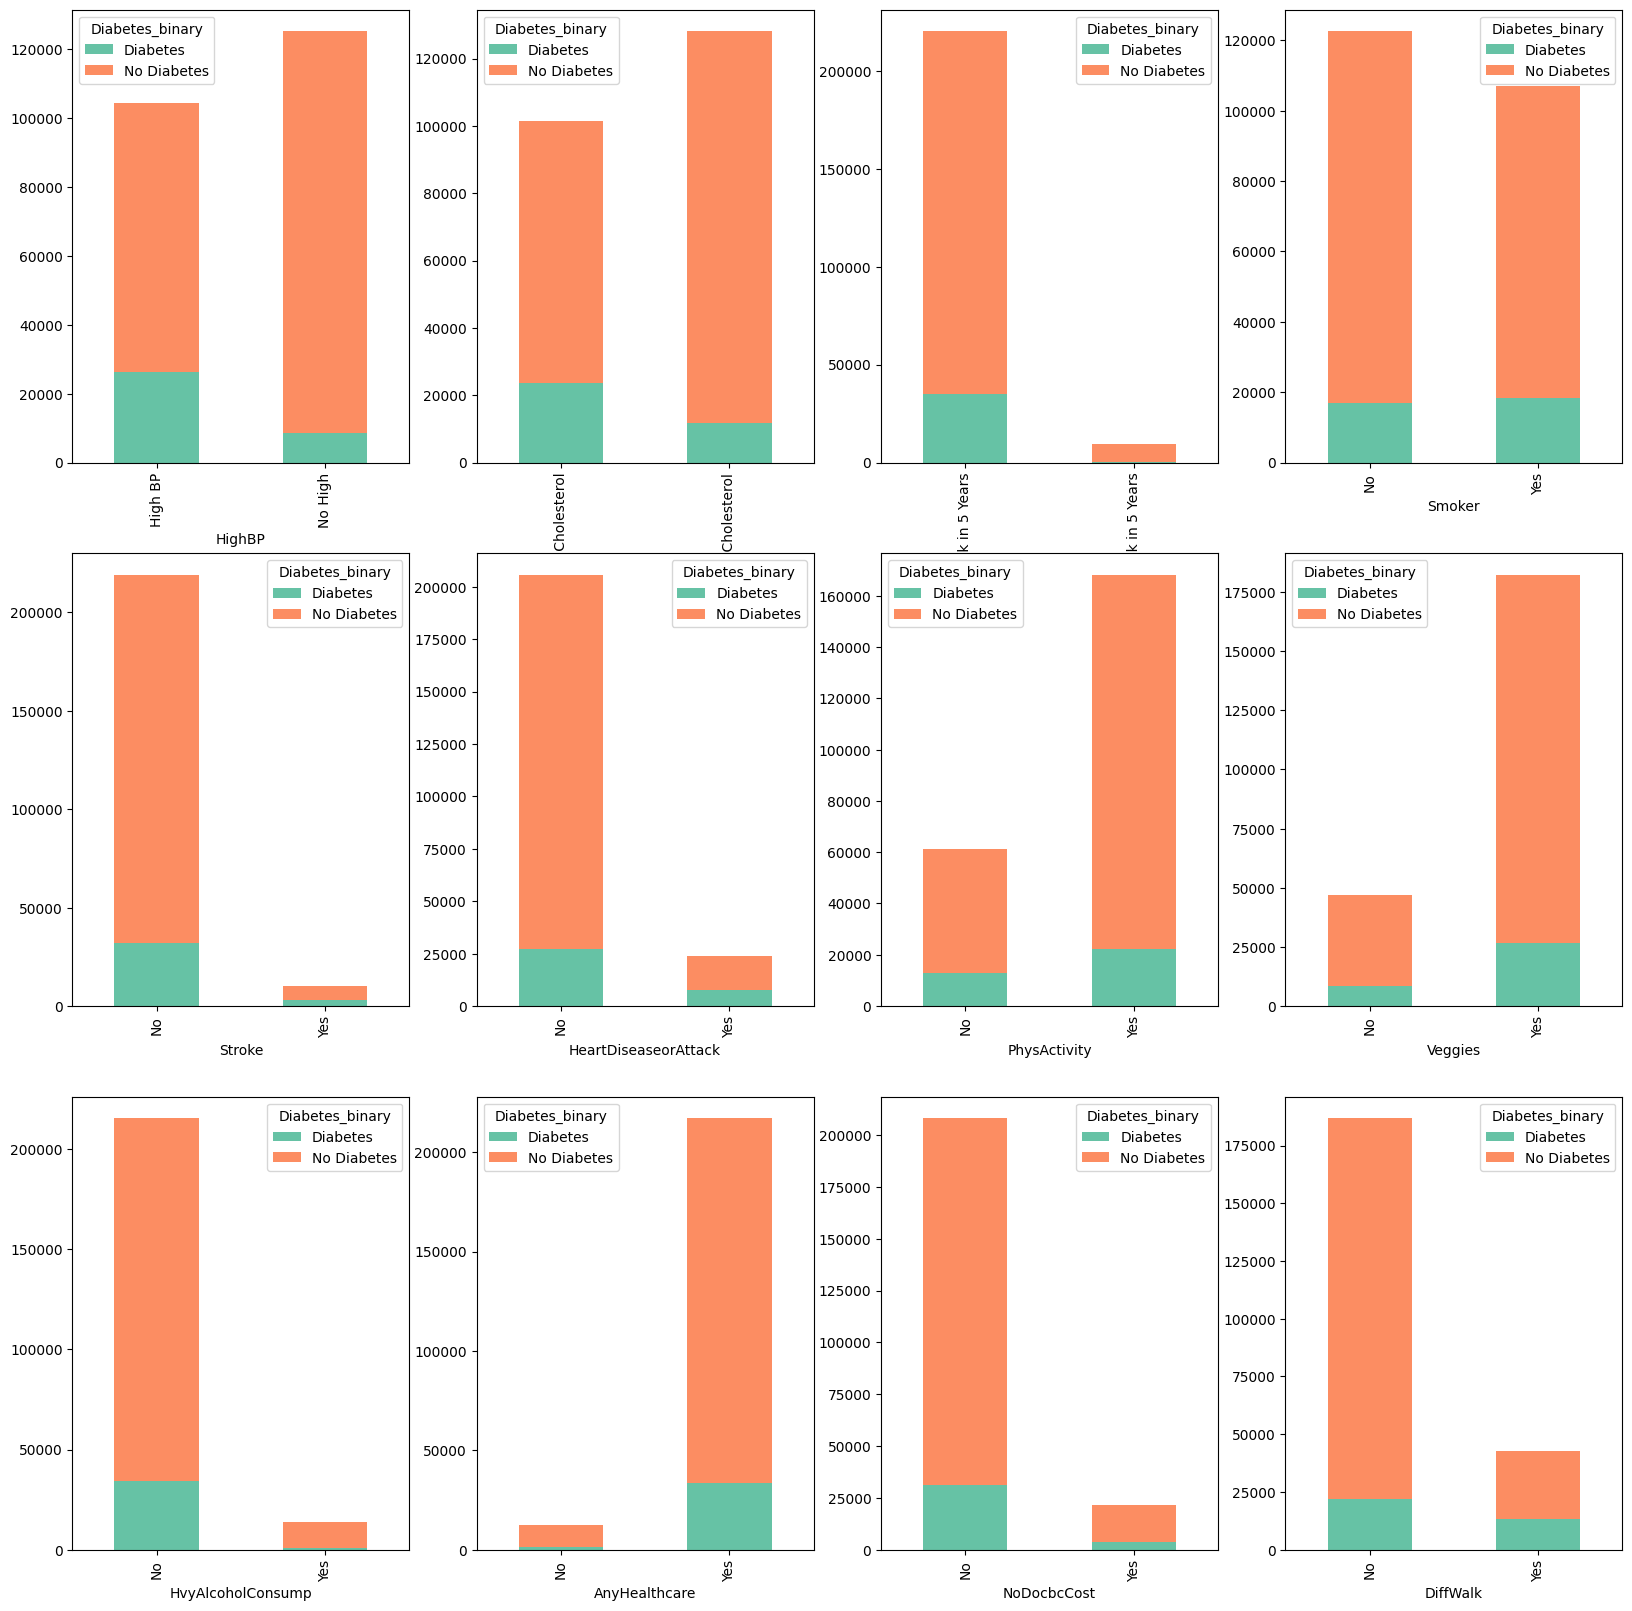
Data visualization
Unique values count
| Variable | Unique Values |
|---|---|
| Diabetes_binary | 2 |
| HighBP | 2 |
| HighChol | 2 |
| CholCheck | 2 |
| BMI | 84 |
| Smoker | 2 |
| Stroke | 2 |
| HeartDiseaseorAttack | 2 |
| PhysActivity | 2 |
| Fruits | 2 |
| Veggies | 2 |
| HvyAlcoholConsump | 2 |
| AnyHealthcare | 2 |
| NoDocbcCost | 2 |
| GenHlth | 5 |
| MentHlth | 31 |
| PhysHlth | 31 |
| DiffWalk | 2 |
| Sex | 2 |
| Age | 13 |
| Education | 6 |
| Income | 8 |
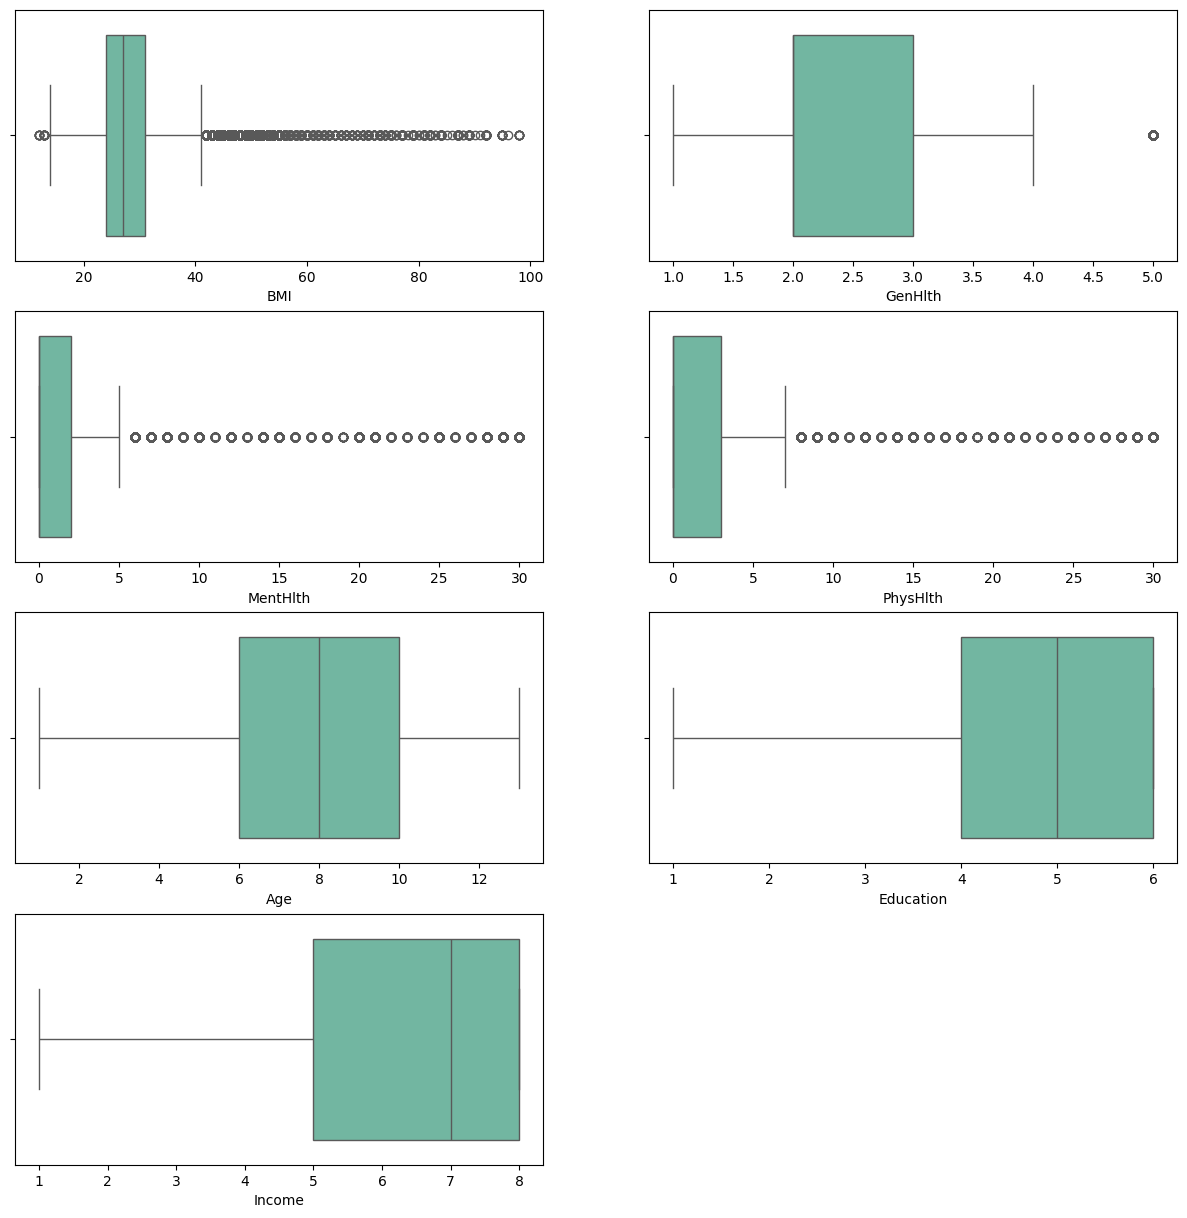
Outliers
Outliers are data points that significantly differ from the rest of the data. They can affect the results of statistical analysis. It is important to identify and handle outliers appropriately to ensure the accuracy and reliability of the analysis.
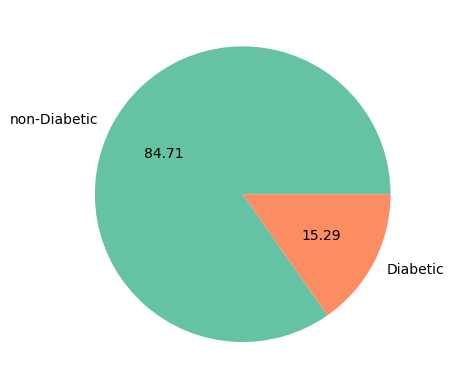
Data distribution
As can be seen in the graph, the data are unbalanced. Therefore, it will be necessary to use techniques that help to balance the data.
Selected Variables
The graph shows the variables selected after a cleaning process.